

Story
Build a Trading Journal from Your Screen Recordings
You screen-record every trading session. The footage is sitting in a folder right now — 2026-06-15.mov, three hours and forty minutes, 2.1 GB. When did you last open one?
Most traders record everything and review almost nothing. The recording feels like diligence. It isn't. A three-hour file you never scrub through is a write-only habit — the trading equivalent of a Watch Later list with 847 videos and 12 watched.
This matters more than it sounds. There's a well-known study by Fernando Chague and colleagues at the University of São Paulo — they tracked every individual who started day trading in the Brazilian futures market between 2013 and 2015. Of those who stuck with it past 300 days, 97% lost money. Only 1.1% out-earned the minimum wage (Chague, De-Losso & Giovannetti, Day Trading for a Living?, 2020). The edge, where it exists at all, is thin. And the only way to find it is to study what you actually did — not what you think you did.
That's what the recording is for. The problem is getting at it.
Why most trading journals stop short
You probably already use a journal. TradeZella, TraderSync, Edgewonk, Tradervue — they import your fills from 500-plus brokers and hand you expectancy, win rate, MAE/MFE, streaks. That's real value. Numbers don't lie about whether your breakout setup makes money on Tuesdays.
But here's the gap. Those numbers tell you that a setup underperforms. They can't tell you why.
Say your pullback longs have a 38% win rate this month. The journal flags it. Now what? The cause isn't in the data — it's in your behaviour. You hesitated four seconds on three of those entries and got a worse fill. You moved your stop twice. You took two of them out of boredom during a dead tape. None of that lives in a fills export. It lives in the recording of your screen, and almost nobody organises that.
Some journals offer "trade replay." TraderSync and TradeZella both have it. Worth being precise about what it is: a reconstruction of the chart from tick and Level II data (TraderSync, 2026). It rebuilds the market. It doesn't rebuild you — your sizing clicks, your cursor hovering over the exit, the news tab you flicked to at 10:31, the Slack message that pulled your attention right before you chased. Edgewonk and Tradervue don't offer replay at all (TradingJournal.com, 2026).
So the metrics tool covers the market. The replay covers the chart. The screen recording is the only record of the decision — and it's the one piece nobody has a system for.
Recording is the easy part
Capturing the session was never the hard bit. OBS, QuickTime, the screen recorder built into your OS — one hotkey and you're rolling. ThinkorSwim, TradingView, your broker's DOM, all of it captured at full fidelity.
The friction is everything after. A 3-hour-40 file has maybe eight moments worth studying: two clean entries, one beautiful exit, one stop you should've honoured, one revenge trade, a missed setup you watched go without you. Six, eight minutes of signal inside 220 minutes of waiting, scrolling, and chat.
To review it, you scrub. You drag the timeline, overshoot, drag back, guess. By the third session you stop opening the files. The recordings pile up. Six months later you've got 120 hours of footage and a vague memory of your own trading.
This is a library problem, not a discipline problem. You don't need more willpower. You need the eight minutes to be findable.
The clipping workflow
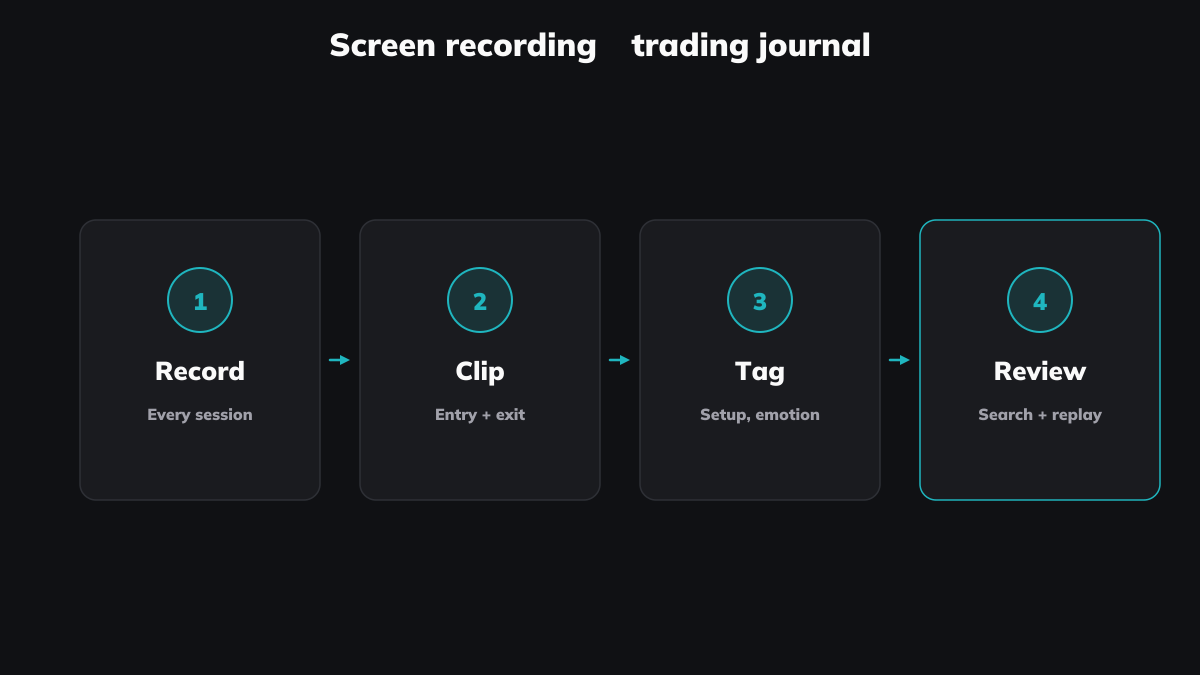
Here's the shift: review the recording once, and as you watch, mark the moments. Don't take notes you'll never reread. Clip.
A clip is a start and an end on the timeline — a 40-second window around an entry, a 20-second exit, the ten seconds where you broke your own rule. You watch the session through at 1.5x, and every time something teachable happens, you mark it. Entry. Exit. Mistake. Missed trade.
You do this once, the day of or the morning after, while the session's fresh. Twenty minutes for a three-hour recording. At the end you don't have a 3-hour file you'll never reopen — you've got eight labelled moments you can pull up in two seconds each.
That's the whole move. Watch once with intent, extract the moments, let the raw file go quiet. The clips are the journal now.
A tagging system that earns its keep
A clip on its own is better than a raw file. A tagged clip is where the edge starts to show.
Tag every clip three ways:
- By setup — breakout, pullback, reversal, opening-range, VWAP reclaim. Whatever your playbook actually contains.
- By outcome — win, loss, scratch. Plain and honest.
- By behaviour — disciplined, FOMO, revenge, hesitation, moved-stop, oversized. This is the tag set most traders skip, and it's the one that pays.
The behaviour tags are the point. Anders Ericsson's work on deliberate practice — the research behind every "10,000 hours" headline — found that expertise doesn't come from repetition. It comes from repetition with immediate, specific feedback on what went wrong (Ericsson et al., 2007). A win-rate number isn't feedback. "Here are the eleven entries this quarter where I hesitated, watch them back to back" — that's feedback.
Rate them too, one to five, on execution quality rather than profit. A 5-star loss is a trade you ran perfectly that the market simply didn't pay. A 1-star win is a reckless trade that worked, which is more dangerous than a clean loss. Profit and execution are different axes. Tagging lets you see both.
Pattern recognition: the part the spreadsheet can't do
Now the library starts working for you.
Search FOMO and you're looking at every impulsive entry you tagged this quarter, back to back. Not a count — the actual footage. You watch six of them in a row and the pattern jumps out: they cluster between 10:15 and 10:45, right after the opening range fails and you're bored. You'd never have seen that from a heatmap. You see it because you're watching yourself do the same thing six times.
Search moved-stop + loss and there's your most expensive habit, on tape.
Filter to reversal + 5-star and you've got a teaching reel of your best work — the trades to burn into muscle memory.
Pull pullback + win next to pullback + loss and watch them side by side. The difference between your winners and losers in the same setup is usually one or two concrete things — entry timing, where you sized in, whether you waited for the close. On tape, the difference is obvious. In a stats table, it's invisible.
This is the bit a journal of numbers structurally can't reach. The numbers point at the symptom. The clips show the cause.
Where Klipptik fits
This is the workflow Klipptik is built for. You load your session recordings — local files, straight off your drive, no upload to anyone's server — and clip the moments as you review. Mark a start, mark an end, tag it, rate it. Your entries, exits, and mistakes become a searchable personal video library instead of a folder of files you avoid.
Search revenge, get every revenge trade. Filter breakout + loss, watch them in sequence with one click. Build a "best executions" set and replay it before the open like a warm-up reel. The raw recordings stay on your machine; Klipptik stores the timestamps and tags — the map to your own footage.
It's honest to say what this isn't. Klipptik won't import your fills or compute your expectancy — TraderSync and TradeZella already do that well, and you should keep using one if you do. Klipptik is the layer underneath your stats: the organised record of the decisions themselves. The two fit together. The journal tells you which setup is leaking money. The clip library shows you the four seconds where it leaks.
And because clips are just timestamps over your own files, the same library holds more than your sessions. The technique video that finally made order flow click. A mentor's session breakdown. They sit alongside your trades, tagged the same way — one reference library for how you trade and how you're learning to trade better.
The compound edge
One reviewed session is a data point. A season of them is an edge.
By month three you're not scrubbing files — you're searching a library of your own behaviour. Every weak habit is tagged, timestamped, and watchable on demand. Every clean execution is saved as a model. The review that used to take an hour of dragging a timeline takes ten minutes, so you actually do it, which is the only reason any of it works.
The 97% who lose aren't all undisciplined. A lot of them are recording everything and learning from none of it — diligent in the moment, blind over time. The footage was always there. They just had no way back into it.
You've already done the hard part. You hit record. Now make the recordings worth something.
Start building your trading library — it's free.